
Conversion Rate Optimization
Same traffic,
more conversions.
You have the traffic. You have conversions. But you also have revenue slipping through the cracks. We find it, test for it, and ship only what the data proves.
CRO works in the right conditions
It’s not the right tool for every business at every stage.
Here’s an honest picture of who gets the most out of it.
Proof, not guesswork.
Everything a proper testing program needs. Nothing that just looks busy.
Three rules. No exceptions.
Every experiment answers to the same three rules. They decide what we test, why, and whether it ships.
Small changes. Big numbers.
At PrintAbout, our experiments surfaced more than 10 million in discovered annual revenue. A few of the wins behind that number.
UX / PRODUCT DESIGN
CRO
We had a killer deal, our users didn’t see it…
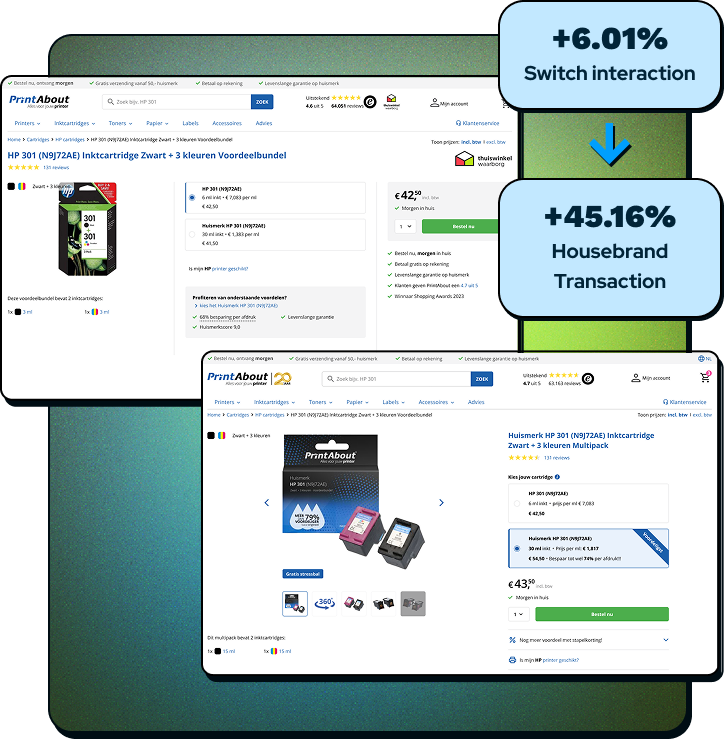
Our housebrand cartridges were cheaper than the big-name stuff—better margins for us, better prices for customers. But people kept buying the expensive option anyway.
We led the UX strategy and design across two rounds of testing, using clickmaps, user interviews, and A/B experiments to figure out why.
This is how we turned hidden value into a 45% boost in housebrand transactions.
ACCESSIBILITY
CRO
No one cares about accessibility… Until you prove it works
We knew the site had accessibility issues: missing focus states, poor contrast, barely any screen reader support.
With a 20+ year-old codebase, nothing is simple. But to be honest, code wasn’t the hardest part, mindset was.
So I did what I always do when something’s hard to sell: I turned accessibility into a business case.
I led the project from the start to the end. Analyzed user data, built buy-in across teams, and delivered WCAG-compliant improvements, without hurting conversions.
We didn’t just improve our site. We set a new standard for how to roll out accessibility changes. Safely, measurably, and without fear.
UX / PRODUCT DESIGN
CRO
PSYCHOLOGY
Shipping costs suck, but what if they didn’t?
Users were ready to buy, the add-to-cart ratio showed this. But they dropped off when they hit the shipping cost. We couldn’t remove the €4.95 fee, the margins were too tight for that.
So the question became:
If we can’t change the price, can we change how it feels?
For this project we led the strategy, research, design, and testing. The goal was to reframe the perception of shipping without touching the cost.
This is how we shipped (pun intended) results under real constraints.
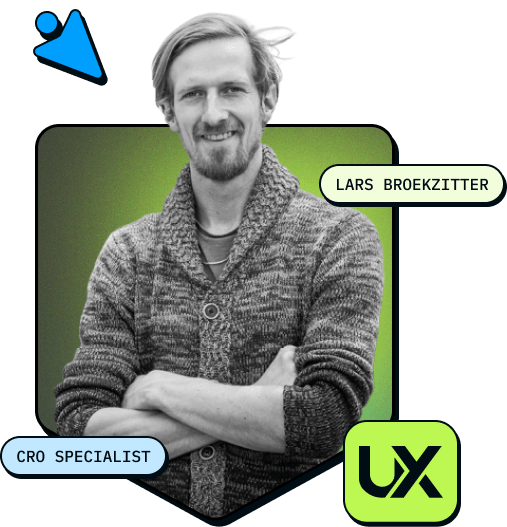
Said it better than we could.
His ability to break down complex challenges and craft intuitive, user-centered solutions backed by real data is truly impressive.
Beyond his remarkable skills, Lars is always ready to support the design community with his valuable insights and guidance, making him a trusted and inspiring figure for anyone fortunate enough to collaborate with him.

My experience with Lars is that he’s very patient, thinks along with you, and is committed to delivering the best possible results to ensure client satisfaction.
I’m absolutely thrilled with the outcome, it looks professional! A beautiful design and stunning business cards. In my view, Lars is highly skilled and delivers top-quality work. I can wholeheartedly recommend him!

My client was struggling with their website’s conversion rate, even though their SEO/SEA traffic had increased significantly. In a 1.5-hour Google Meet call, Lars provided a lot of actionable recommendations to improve conversions. He was able to clearly back up all of his tips with research and data as well. It was also evident during the call that Lars has a lot of knowledge and experience in CRO & UX-design. He really knows what he’s talking about.
If you’re looking for actionable tips to get more out of your website, I highly recommend reaching out to him.

Omdat wij als vrijwilligers organisatie niet altijd de beste kennis in huis hebben was het belangrijk om de juiste kennis in huis te halen omadat de website verouderd was geraakt en niet langer gemakkelijk te onderhouden.
Na een volledige doorlichting van de website heeft Lars de pijnpunten gedefinieerd en alles gestroomlijnd zodat ook naar de toekomst toe met minimale inzet het maximale gehaald kan worden want de website is simpel en snel aan te passen.
ook zijn oude plugins en zaken die er niet meer toe deden systematisch verwijderd. Kortom een top resulaat waar we nog jaren mee vooruit kunnen!

“Design without evidence is just expensive wallpaper.”
Let’s find your missing revenue.
Tell us about your site and your traffic. We’ll tell you where the opportunity is, and whether CRO is even the right move yet. No sales pitch, just a straight answer.